As more OpenTelemetry (OTel) instrumentation is being deployed across our applications and infrastructure, we need ways of understanding the actual payloads of the telemetry being sent and received, so that we can validate what’s being sent and received, to drive accurate analysis and optimization. The OpenTelemetry collector is a powerful piece of software with many capabilities, but sometimes, there’s no substitute to “cracking open” some of the telemetry data to see what’s actually being received, or sent. Common questions that often arise once you start with the OTel collector include:
- Is data even being received by the collector? How do I know?
- How are the OTel “attributes” or “resource attributes” associated with the telemetry (logs, metrics, traces) actually getting populated (if at all)? How can I see them?
- If I have enrichment, or other transformation/optimization “processors” in place, how do I know if they’re working and that I’ve configured them correctly?
The Remote Tap Processor
The Remote Tap Processor is currently part of the OpenTelemetry Contrib repo. Recall that the OTel collector simply takes a set of telemetry sources (”receivers”) and wires those to a set of destinations (”exporters”) via one or more pipelines. Those pipelines can be configured with “processors” to enrich, transform and optimize the telemetry as it flows through the pipeline. The remote tap processor is a type of processor that samples a subset of traffic flowing through the pipeline and makes that sample available to a WebSocket client. You can position the processor anywhere in the pipeline (order is important as we’ll see) and you can also add more than one of them – for example to sample the telemetry coming in before is it transformed, and after it goes out of the pipeline post transformation.
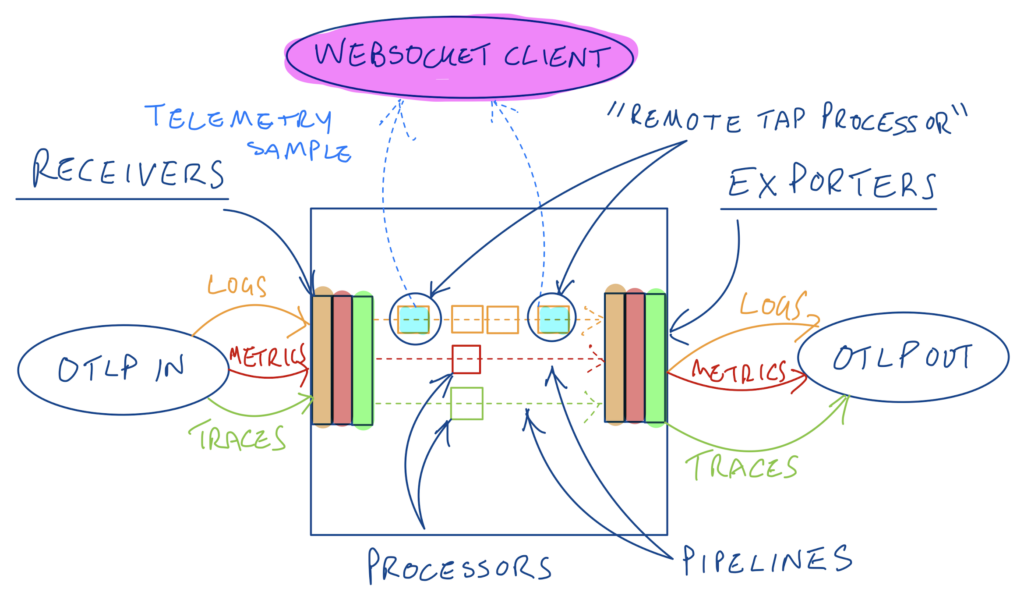
Tapping the start and end of a logs pipeline in a collector
Setup
We will use the configuration in a previous blog here as a starting point, where we optimized all three telemetry types. In the readme for the remotetap processor, we see it runs on port 12001 and listens on localhost by default, and that it rate limits the sampled telemetry to one message per second by default (this is configurable). We plan to leverage two remote tap processors here – one for the start of the pipeline and one for the end. The “start” tap processor will run on the default port and the second “end” tap processor will be configured to run on port 12002. To run the websocket client, we will use a utility called websocat available here. To run this utility from the command line to connect to the start tap processor for example, we can execute the following in our terminal:
websocat ws://127.0.0.1:12001
Logs Pipeline Validation
We’ll start with validating our logs pipeline. Recall that we had previously optimized our logs by filtering out logs with low level severities (< WARN), and by deduplicating them in two processors chained together. You can find the collector configuration in the following GitHub Gist
There are two Remote Tap processors defined:
processors:
    remotetap/start:
        endpoint: 0.0.0.0:12001
    remotetap/end:
        endpoint: 0.0.0.0:12002
and then these two processors are referenced at the start and end of the logs pipeline respectively:
service:
    pipelines:
        logs:
            exporters:
                - debug
            processors:
                - remotetap/start
                - filter/severity
                - logdedup
                - batch
                - remotetap/end
            receivers:
                - otlp
Assuming the configuration is saved to a file called configremotetap.yaml, run the OTel collector as a Docker container as follows:
docker run -v $(pwd)/configremotetap.yaml:/etc/otelcol-contrib/config.yaml -p 4317:4317 -p 4318:4318 -p 12001:12001 -p 12002:12002 otel/opentelemetry-collector-contrib:latest
Note that in addition to the two OTLP receiver ports (that we’ll send telemetry traffic to), we have also exposed the ports for the two remote tap processors, so that we can connect to them with our WebSocket client.
Generate Telemetry
We’ll be using the handy otelgen tool again to generate OTel telemetry to send to the OTLP receiver defined in the collector configuration. You can install this locally or run it as a container. For example, to generate logs using Docker and direct them to the OTLP receiver running in our other container (on our mac):
docker run --rm ghcr.io/krzko/otelgen:latest --otel-exporter-otlp-endpoint host.docker.internal:4317 --insecure logs m
Let the logs (samples) flow!
Now we can use the websocat client to see the sampled logs from the start remote tap processor (i.e. the incoming logs before they are transformed in our pipeline) in our terminal – we’ll also use jq to make these more readable, like:
websocat ws://127.0.0.1:12001 | jq '.'
You should see something like the following – we can already see useful information including the aforementioned resource attributes (in this case from K8s) and attributes. We can also see the log severity in here – which one of our subsequent processors will filter on.
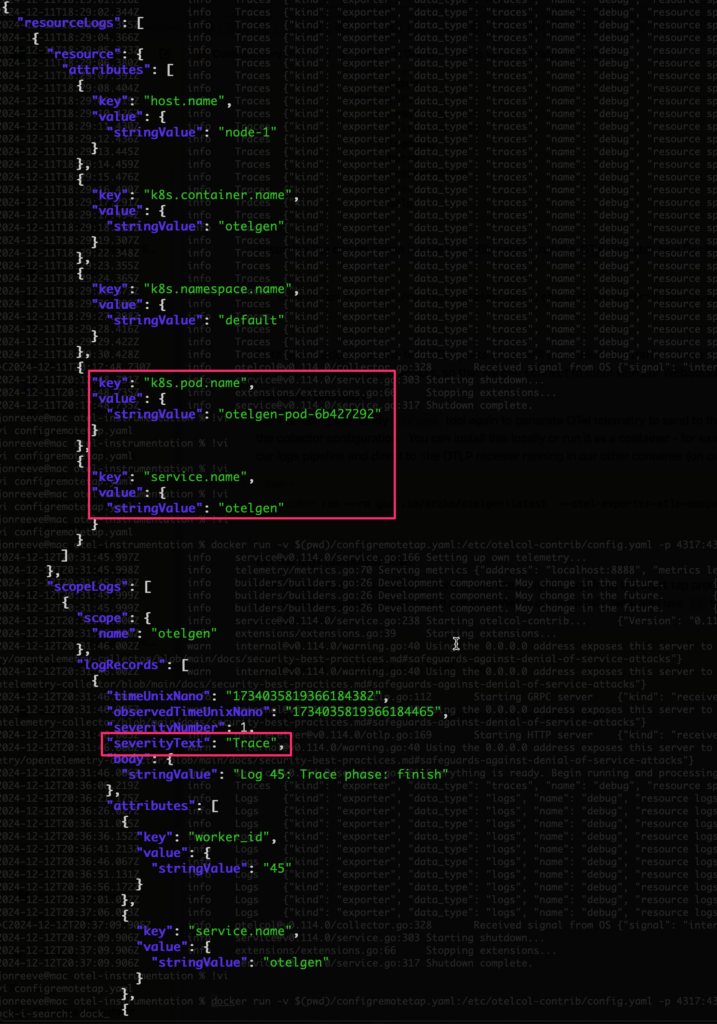
Introspecting the Logs JSON
Start and End
Let’s now validate the 1st of the optimization processors in our logs pipeline – recall that this is a filter to remove logs with severity < WARN – from our config:
    filter/severity:
        logs:
            log_record:
                - severity_number < SEVERITY_NUMBER_WARN
Let’s validate if this is happening – in one terminal for the start tap processor, run:
websocat ws://127.0.0.1:12001 | jq '.' | grep severityText
and in the other terminal – for the end tap processor, run:
websocat ws://127.0.0.1:12002 | jq '.' | grep severityText
You should see something like:
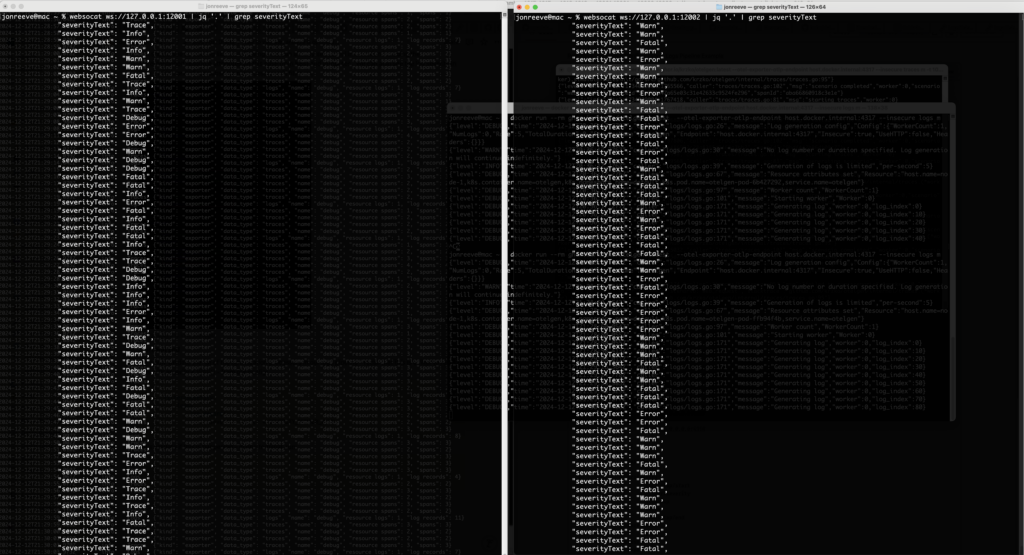
Logs In (left) vs Logs Out (right)
i.e. you should only see “TRACE”, “DEBUG”, or “INFO” logs at the start of the pipeline and not at the end, if they have been successfully filtered out.
Log DeDuplication Verification
Let’s also revisit the log deduplication processor in our config:
    logdedup:
        interval: 5s
        log_count_attribute: dedup_count
        timezone: America/Chicago
According to the readme for this processor, the attribute defined as dedup_count above, should get injected into our log messages by the deduplication processor, so we should see this attribute only at the end of our logs pipeline, and not at the beginning. This time let’s run the following in our start tap processor terminal:
websocat ws://127.0.0.1:12001 | jq '.resourceLogs[].scopeLogs[].logRecords[].attributes[] | select(.key=="dedup_count")'
and this in our end tap processor terminal:
websocat ws://127.0.0.1:12002 | jq '.resourceLogs[].scopeLogs[].logRecords[].attributes[] | select(.key=="dedup_count")'
We should not get any results from the 1st command since that attribute should not be there yet, and we should see the attribute show up only in our second (end) terminal like:
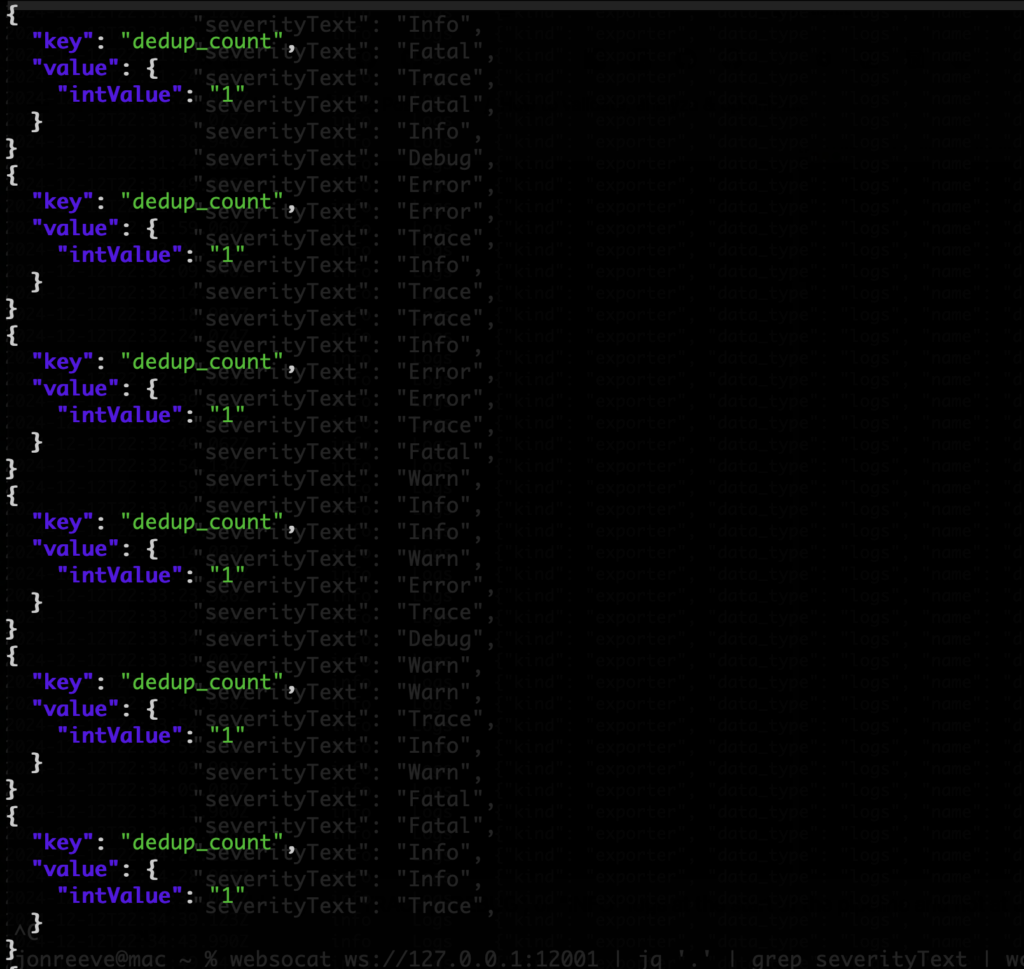
Validating the Deduplication Processor
This confirms that the processor is working (injecting the attribute), and also, that we don’t appear to be getting any deduplication of logs for this particular otelgen scenario (since the “dedup_count” is always 1).
Traces Pipeline Validation
One more example – recall that we had a “tail based sampling” processor that would only forward traces that met a latency threshold OR had errors in them. From the config above:
    tail_sampling:
        decision_wait: 10s
        num_traces: 100
        expected_new_traces_per_sec: 10
        decision_cache:
          sampled_cache_size: 100000
        policies:
          - name: test-policy-1
            type: latency
            latency:
              threshold_ms: 200
          - name: test-policy-2
            type: status_code
            status_code:
              status_codes:
                - ERROR
Looking at the configuration of the collector we applied from the Gist, we can see that we’ve configured the remote tap processors for the traces pipeline, the same way we did for the logs one – with the “start” tap processor as the 1st in the pipeline and the “end” tap processor at the end:
        traces:
            exporters:
                - debug
            processors:
                - remotetap/start
                - tail_sampling
                - batch
                - remotetap/end
            receivers:
                - otlp
If you haven’t already – you can cancel your logs generation from otelgen – we’re going to generate traces now into the traces pipeline. Leveraging the help -h option for otelgen shows that traces generation supports various scenarios:

Trace Generation
We will use the web_request scenario to generate (e.g. 1000) traces like so:
docker run --rm ghcr.io/krzko/otelgen:latest --otel-exporter-otlp-endpoint host.docker.internal:4317 --insecure traces m -t 1000 -s web_request
We can start by taking a look at some sample traces coming in to the traces pipeline with the start remote tap processor:
websocat ws://127.0.0.1:12001 | jq '.'
You should see something like the following – resourceSpans objects, each with an array of spans corresponding to a given trace (id). Recall that the trace processor we set up was looking for traces with a latency greater than 200ms (above).
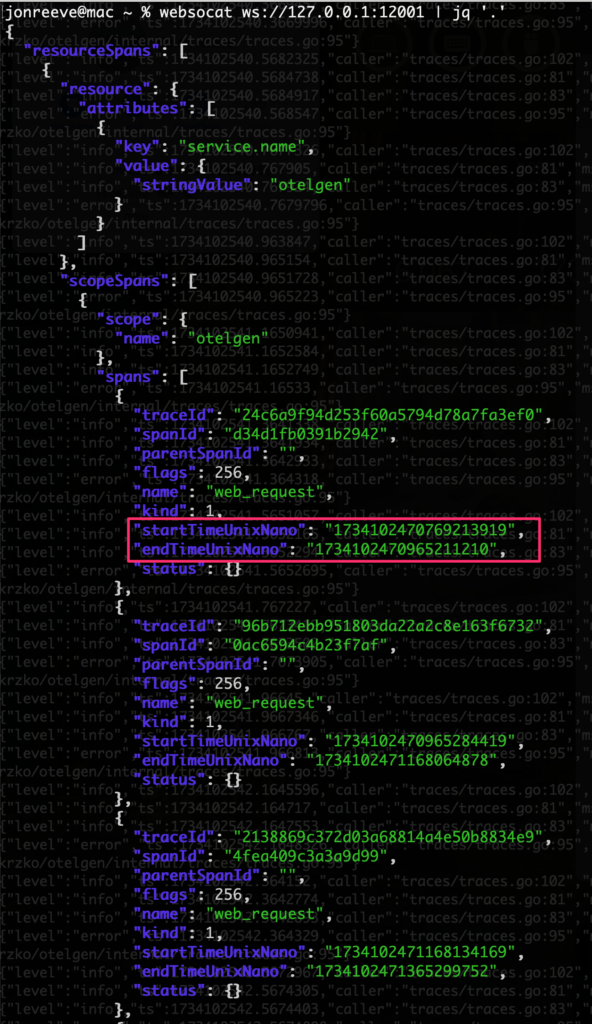
Sample Span/Trace Data
We can compute the latency on the individual spans by subtracting the start time from the end time using jq like follows:
websocat ws://127.0.0.1:12001 | jq '. |= (.duration = ((.resourceSpans[].scopeSpans[].spans[].endTimeUnixNano|tonumber) - (.resourceSpans[].scopeSpans[].spans[].startTimeUnixNano|tonumber))/1000000)' | grep duration
This computes a duration (in ms) and adds that field to the JSON, and we grep it out. Now let’s run this same command on the start and end processors as we did above, to look at the latency numbers before and after the tail sampling processor – you should see something like:
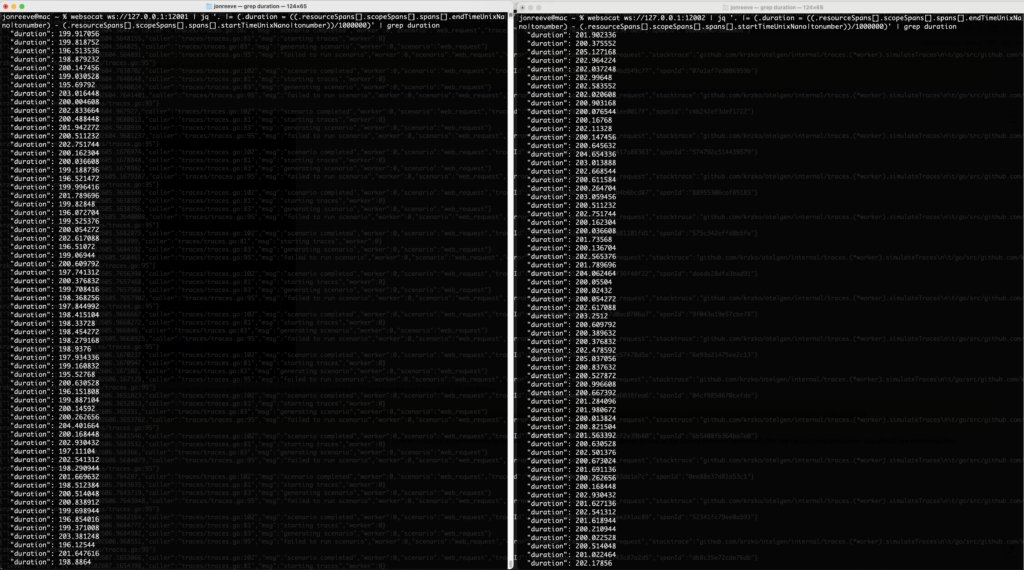
Span Latency before (left) and after (right) the tail sampling processor
We can see that the latency being reported for spans after the tail sampling processor are now all > 200ms as we expect 🙌 Astute readers familiar with the tail sampling processor will note that we are really computing span latency here, not trace latency (a collection of spans relating to the same trace id) – but if a span is more than 200ms, the trace itself must at least have that much latency, so this is a pretty good indicator that things are working as we would expect.
Summary
In this blog, we reviewed the need, and the power of getting at the underlying data that is flowing through the OTel collector. Whether it’s to understand the specifics of the data coming in, ensuring transformation or optimization is happening as we expect, or to simply understand if the collector is functioning! We talked about the need to be able to program our collectors “on the fly” in a previous post – the remote tap processor is another great example of that. Furthermore, getting at the underlying data that is flowing through opens up the potential of driving intelligent feedback loops that optimize the telemetry for us – think self driving for your observability 🙂 If you’re interested in learning more about this and what we’re working on, don’t hesitate to reach out!


