In the blog, we’ll explore the OpenTelemetry DataDog Receiver kindly donated to the community by Grafana. We’ll review why you might want to convert your DataDog Metrics and Traces into OpenTelemetry (OTel) format and a step-by-step walkthrough.
No More Roach OTel!
So nobody wants a “Roach OTel” – a place where OTel can check in but never check out! One of the drivers for OpenTelemetry is to enable choice with a wide potential variety of “observability backends”.
In our case, we are assuming an existing application, already instrumented with ddtrace – DataDog’s tracing library . Maybe we’re looking to start migrating to OpenTelmetry, leveraging other observability backends, or simply getting more control over our existing telemetry. Let’s take a look.
What We’re Going To Do
In this blog, we’re going to instrument an example Python application with DataDog’s tracing library ddtrace – and we’re going to intercept traces thrown off by that with an OpenTelemetry collector running a DataDog receiver. We’re then going to route those traces to a “debug exporter” so we can view them in our terminal. We’ll run the Python Flask app in a virtual Python environment, and the OTel collector as a Docker container.

Our Application
Let’s take a simple Python application – we can use the dice roll example Python Flask app from the OpenTelmetry docs, except this time, we’re going to instrument the app with DataDog before converting it!
Set up your environment
mkdir otel-getting-started
cd otel-getting-started
python3 -m venv venv
source ./venv/bin/activate
Install Flask
pip install flaskWe’re also going to want to install the DataDog APM tracing library ddtrace that we’re going to use to trace the application in this case
pip install ddtraceCreate the code in app.py
from random import randint
from flask import Flask, request
import logging

app = Flask(__name__)
logging.basicConfig(level=logging.INFO)
logger = logging.getLogger(__name__)


@app.route("/rolldice")
def roll_dice():
    player = request.args.get('player', default=None, type=str)
    result = str(roll())
    if player:
        logger.warning("%s is rolling the dice: %s", player, result)
    else:
        logger.warning("Anonymous player is rolling the dice: %s", result)
    return result


def roll():
    return randint(1, 6)
Then run the app with the ddtrace library by using ddtrace-run
ddtrace-run flask run -p 8080We can then visit http://localhost:8080/rolldice on the browser or curl like
curl 'http://127.0.0.1:8080/rolldice?player=king'Run an OpenTelemetry Collector
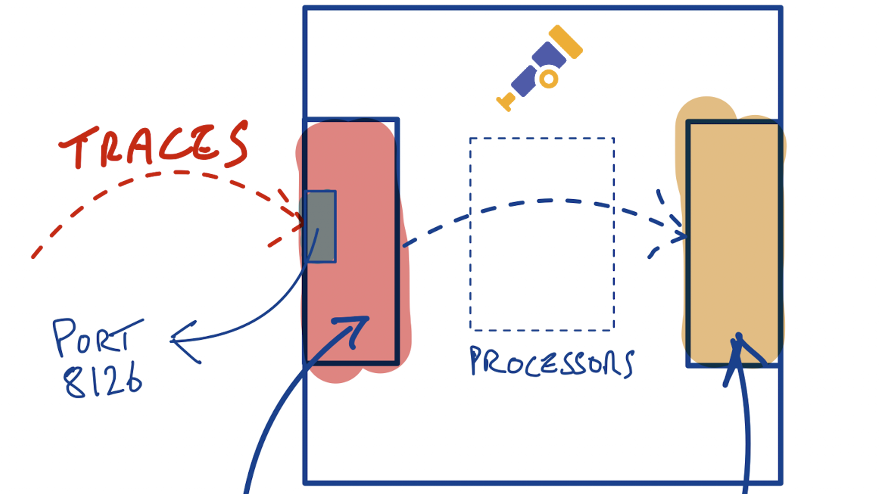
The OpenTelemetry collector is one of the key pieces in the OTel project, allowing telemetry to be received with “receivers”, (optionally) processed with processors, and exported to observability backends (or other collectors..) with “exporters”. In our case, we’re going to use the DataDog receiver and a “debug” exporter, we’ll skip the processor for now but these are recommended for production deployments. The debug exporter exports telemetry to the console and is helpful to validate that things are working and flowing! You can also set different verbosity levels including emitting all the fields for each telemetry record.

To run the collector, we’re going to use Docker (so you’ll need Docker installed). Looking at the docs, we can see that we can pass in a collector configuration file mounted as a volume
docker run -v $(pwd)/config.yaml:/etc/otelcol-contrib/config.yaml otel/opentelemetry-collector-contrib:0.110.0The collector configuration file is in YAML format, and defines the various receivers, processors, exporters and other components that can be leveraged by the collector. Looking back at the docs for the DataDog receiver, we can see a minimal configuration to get the receiver going:
receivers:
  datadog:
    endpoint: 0.0.0.0:8126
    read_timeout: 60s

exporters:
  debug:

service:
  pipelines:
    metrics:
      receivers: [datadog]
      exporters: [debug]
    traces:
      receivers: [datadog]
      exporters: [debug]
Looking at the configuration, we start with the DataDog receiver – we’re going to run this on our local host and it will listen on port 8126 – the port that the DataDog agent (not running here) listens on by default and also the default port that ddtrace sends info to. We can see that our debug exporter is defined and per the docs defaults to a basic verbosity which should output “a single-line summary of received data with a total count of telemetry records for every batch of received logs, metrics or traces” – cool. Finally, we have our “pipelines” which are defined per telemetry type (logs, metrics, traces and more coming!), and tie together our inputs, processing via processors (if we had some) and where to send the telemetry via exporters (to the debug exporter in our case)
Save the above file as datadog_config.yaml or similar and then run the collector – we also want to expose port 8126 on our receiver in the container since this is the port our receiver is listening on.
docker run -v $(pwd)/datadog_config.yaml:/etc/otelcol-contrib/config.yaml -p 8126:8126 otel/opentelemetry-collector-contrib:0.110.0Putting it all together
Now let’s run our app again and query it with curl or in the browser at http://localhost:8080/rolldice
ddtrace-run flask run -p 8080In your console where you ran the collector, you should see a message coming from the debug exporter like
2024-10-02T19:11:25.072Z info TracesExporter {"kind": "exporter", "data_type": "traces", "name": "debug", "resource spans": 1, "spans": 9}Yay! Looks like we got a trace…..Remember we were running the debug exporter with the default basic verbosity – let’s turn it up to 11 and a a verbosity of detailed. We can modify our collector configuration file as follows
receivers:
  datadog:
    endpoint: 0.0.0.0:8126
    read_timeout: 60s

exporters:
  debug:
    verbosity: detailed

service:
  pipelines:
    metrics:
      receivers: [datadog]
      exporters: [debug]
    traces:
      receivers: [datadog]
      exporters: [debug]
Save the configuration file, re-run your container and query your app again – you should see something like
2024-10-02T19:21:10.142Z	info	TracesExporter	{"kind": "exporter", "data_type": "traces", "name": "debug", "resource spans": 1, "spans": 9}
2024-10-02T19:21:10.143Z	info	ResourceSpans #0
Resource SchemaURL: https://opentelemetry.io/schemas/1.16.0
Resource attributes:
     -> telemetry.sdk.name: Str(Datadog)
     -> telemetry.sdk.language: Str(python)
     -> process.runtime.version: Str(3.12.6)
     -> telemetry.sdk.version: Str(Datadog-2.14.1)
     -> service.name: Str(flask)
ScopeSpans #0
ScopeSpans SchemaURL:
InstrumentationScope Datadog 2.14.1
Span #0
    Trace ID       : 00000000000000005df358c588cf97cc
    Parent ID      :
    ID             : 07e7cde5f7bc2378
    Name           : flask.request
    Kind           : Server
    Start time     : 2024-10-02 19:21:10.10128 +0000 UTC
    End time       : 2024-10-02 19:21:10.105011 +0000 UTC
    Status code    : Ok
    Status message :
Attributes:
     -> dd.span.Resource: Str(GET /rolldice)
     -> sampling.priority: Str(1.000000)
     -> datadog.span.id: Str(569650265473164152)
     -> datadog.trace.id: Str(6769852270295095244)
     -> flask.endpoint: Str(roll_dice)
     -> flask.url_rule: Str(/rolldice)
     -> _dd.p.tid: Str(66fd9d2600000000)
     -> http.method: Str(GET)
     -> http.useragent: Str(Mozilla/5.0 (Macintosh; Intel Mac OS X 10_15_7) AppleWebKit/605.1.15 (KHTML, like Gecko) Version/18.0 Safari/605.1.15)
     -> _dd.p.dm: Str(-0)
     -> component: Str(flask)
     -> flask.version: Str(3.0.3)
     -> span.kind: Str(server)
     -> language: Str(python)
     -> http.status_code: Str(200)
     -> http.route: Str(/rolldice)
     -> _dd.base_service: Str()
     -> runtime-id: Str(0c847e83f3684314a595e42a7ecd4088)
     -> http.url: Str(http://localhost:8080/rolldice)
     -> process.pid: Double(73137)
     -> _dd.measured: Double(1)
     -> _dd.top_level: Double(1)
     -> _sampling_priority_v1: Double(1)
     -> _dd.tracer_kr: Double(1)
Span #1
    Trace ID       : 00000000000000005df358c588cf97cc
    Parent ID      : 07e7cde5f7bc2378
    ID             : f438270f8c9f294f
    Name           : flask.application
    Kind           : Unspecified
    Start time     : 2024-10-02 19:21:10.102173 +0000 UTC
    End time       : 2024-10-02 19:21:10.104421 +0000 UTC
    Status code    : Ok
    Status message :
Attributes:
     -> dd.span.Resource: Str(GET /rolldice)
     -> datadog.span.id: Str(17597858491687446863)
     -> datadog.trace.id: Str(6769852270295095244)
     -> component: Str(flask)
     -> flask.endpoint: Str(roll_dice)
     -> flask.url_rule: Str(/rolldice)
     -> _dd.base_service: Str()
Span #2
    Trace ID       : 00000000000000005df358c588cf97cc
    Parent ID      : f438270f8c9f294f
    ID             : 5b4b30645f20df84
    Name           : flask.preprocess_request
    Kind           : Unspecified
    Start time     : 2024-10-02 19:21:10.102942 +0000 UTC
    End time       : 2024-10-02 19:21:10.102986 +0000 UTC
    Status code    : Ok
    Status message :
Attributes:
     -> dd.span.Resource: Str(flask.preprocess_request)
     -> datadog.span.id: Str(6578404888355594116)
     -> datadog.trace.id: Str(6769852270295095244)
     -> _dd.base_service: Str()
     -> component: Str(flask)
Span #3
    Trace ID       : 00000000000000005df358c588cf97cc
    Parent ID      : f438270f8c9f294f
    ID             : 6697ba8cc0fd2ee8
    Name           : flask.dispatch_request
    Kind           : Unspecified
    Start time     : 2024-10-02 19:21:10.103161 +0000 UTC
    End time       : 2024-10-02 19:21:10.103863 +0000 UTC
    Status code    : Ok
    Status message :
Attributes:
     -> dd.span.Resource: Str(flask.dispatch_request)
     -> datadog.span.id: Str(7392582427047964392)
     -> datadog.trace.id: Str(6769852270295095244)
     -> component: Str(flask)
     -> _dd.base_service: Str()
Span #4
    Trace ID       : 00000000000000005df358c588cf97cc
    Parent ID      : 6697ba8cc0fd2ee8
    ID             : 1d3ddf848a518680
    Name           : app.roll_dice
    Kind           : Unspecified
    Start time     : 2024-10-02 19:21:10.103318 +0000 UTC
    End time       : 2024-10-02 19:21:10.10384 +0000 UTC
    Status code    : Ok
    Status message :
Attributes:
     -> dd.span.Resource: Str(/rolldice)
     -> datadog.span.id: Str(2107085961028535936)
     -> datadog.trace.id: Str(6769852270295095244)
     -> component: Str(flask)
     -> _dd.base_service: Str()
Span #5
    Trace ID       : 00000000000000005df358c588cf97cc
    Parent ID      : f438270f8c9f294f
    ID             : 4033ff6fee71f85f
    Name           : flask.process_response
    Kind           : Unspecified
    Start time     : 2024-10-02 19:21:10.104038 +0000 UTC
    End time       : 2024-10-02 19:21:10.10406 +0000 UTC
    Status code    : Ok
    Status message :
Attributes:
     -> dd.span.Resource: Str(flask.process_response)
     -> datadog.span.id: Str(4626322098446530655)
     -> datadog.trace.id: Str(6769852270295095244)
     -> component: Str(flask)
     -> _dd.base_service: Str()
Span #6
    Trace ID       : 00000000000000005df358c588cf97cc
    Parent ID      : f438270f8c9f294f
    ID             : a235e4ef33f1389b
    Name           : flask.do_teardown_request
    Kind           : Unspecified
    Start time     : 2024-10-02 19:21:10.104279 +0000 UTC
    End time       : 2024-10-02 19:21:10.104304 +0000 UTC
    Status code    : Ok
    Status message :
Attributes:
     -> dd.span.Resource: Str(flask.do_teardown_request)
     -> datadog.span.id: Str(11688500123929753755)
     -> datadog.trace.id: Str(6769852270295095244)
     -> component: Str(flask)
     -> _dd.base_service: Str()
Span #7
    Trace ID       : 00000000000000005df358c588cf97cc
    Parent ID      : f438270f8c9f294f
    ID             : f51c81e921f0e5ab
    Name           : flask.do_teardown_appcontext
    Kind           : Unspecified
    Start time     : 2024-10-02 19:21:10.104358 +0000 UTC
    End time       : 2024-10-02 19:21:10.104391 +0000 UTC
    Status code    : Ok
    Status message :
Attributes:
     -> dd.span.Resource: Str(flask.do_teardown_appcontext)
     -> datadog.span.id: Str(17662134676937041323)
     -> datadog.trace.id: Str(6769852270295095244)
     -> component: Str(flask)
     -> _dd.base_service: Str()
Span #8
    Trace ID       : 00000000000000005df358c588cf97cc
    Parent ID      : 07e7cde5f7bc2378
    ID             : 1d3f1d1da3c5a10b
    Name           : flask.response
    Kind           : Unspecified
    Start time     : 2024-10-02 19:21:10.104438 +0000 UTC
    End time       : 2024-10-02 19:21:10.104995 +0000 UTC
    Status code    : Ok
    Status message :
Attributes:
     -> dd.span.Resource: Str(flask.response)
     -> datadog.span.id: Str(2107435163771576587)
     -> datadog.trace.id: Str(6769852270295095244)
     -> component: Str(flask)
     -> _dd.base_service: Str()
	{"kind": "exporter", "data_type": "traces", "name": "debug"}
You can read more about the OpenTelemetry trace format here, but just by scanning through the above we can see the request and response (spans) to our Python Flask app. If we wanted to, we could export these traces to something like Jaeger using OTLP by editing our configuration file further.
Summary
In this blog, we instrumented a basic Python application using DataDog (tracing) libraries, and forwarded those to an OpenTelemetry collector that converted those to OTel format using a “DataDog Receiver”, and forwarded those to a “Debug Exporter” that allowed us to view the converted traces in our console. In reality, many folks will have an existing DataDog agent currently deployed to receive and forward these traces (and other signals) – in future posts, we’ll look at how we can dual forward or “dual ship” our telemetry signals from an existing observability agent to an existing observability backend and an OTel collector in parallel. We’ll also look at placing an OTel collector “in line” so that it can process and transform existing telemetry on it’s way to an existing backend, so that existing telemetry can be reduced and optimized to minimize cost and maximize utility of that telemetry.


