Create New Observability Insights
Home / Solutions / Use Cases / Create New Observability Insights

Reduce MTTR & Accelerate RCA
Problem – Rising MTTR, Ineffective Root Cause, Hidden KPIs
Observability is failing to meet expectations. The outcomes associated with observability should be improving root cause analysis, lowering mean time to repair (MTTR), illuminating critical business metrics, and accelerating incident management versus slowing it down. Key observability shortcomings include:
- Inefficient root cause analysis (RCA)
- Worsening MTTR
- High cost of ingesting, storing, sifting through unnecessary telemetry data
- Identifying the right traces to store to drive better RCA
- Generating meaningful business KPIs
- Ensuring privacy, compliance of observability data
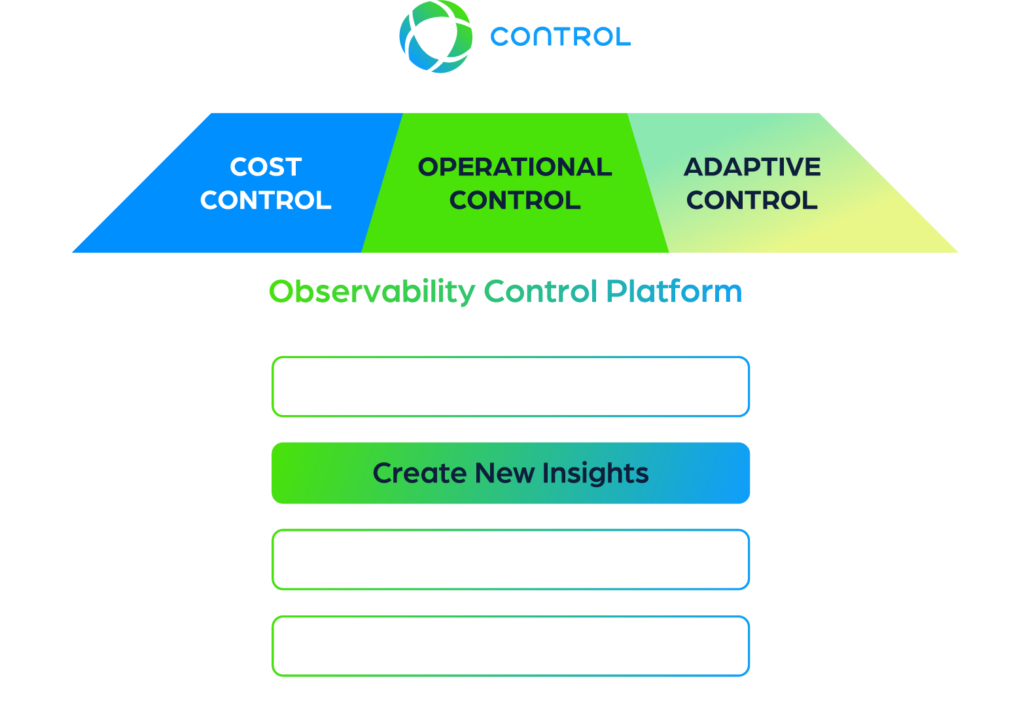
Observability needs to evolve; controllability empowers observability where it falls short today. So how do you maximize observability results and improve RCA, lower MTTR, ensure compliance, and unlock new business key performance indicators (KPIs)?
Solution – 5 Ways to Create New Observability Insights
Creating new observability insights and maximizing the value of your existing observability requires optimizing how telemetry data is used and shaped so it can accelerate root cause, generate more signal and KPIs and less noise while ensuring regulatory compliance. There are five key ways to create new observability data insights:
- Tail Sample Traces to Optimize RCA
- Correlate Telemetry with Developer Deploys, PRs, Commits, and Repositories
- Cost-Effectively Generate, Share New Business Custom Metric KPIs
- Mask Observability for Safe, Compliant, and Secure Data Sharing
- Store Traces for Latency Regression Analysis


1. Tail Sample Traces to Optimize RCA
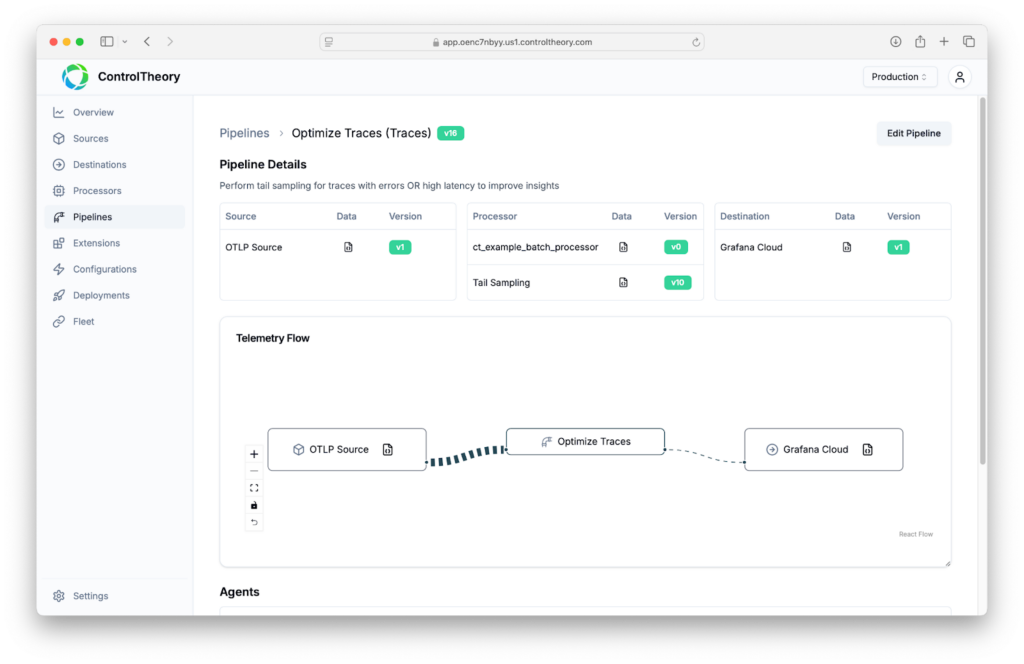
Tail sampling traces enable intelligent retention and more effective root cause analysis by evaluating complete traces against defined rules and policies, detecting conditions such as high latency or ERRORs in your telemetry flow before it reaches your observability system. This ensures that only the most relevant traces are ingested, analyzed, and retained for analysis. Teams can focus on just the high-signal traces to reduce mean time to identification (MTTI) and mean time to resolution (MTTR) of service issues and greatly reduce the cost of using traces inside existing observability platforms that do not support tail-sampling.
Why Use Tail Sampling?
Other sampling strategies such as head sampling or probabilistic sampling are less effective as they make decisions to retain at the beginning of a trace, without insight into whether the trace has valuable information, or they blindly pull traces whether they are useful or not.

2. Correlate Telemetry with Developer Deploys, PRs, Commits, and Repositories
Observability issues are often correlated with a new software deploy, a code commit, or a GitHub pull request (PR). Changes in observability behavior such as a spike in volume or a sudden burst of new telemetry signal can be traced back to the relevant changes and actions in such systems as GitHub, Backstage, or the relevant CI/CD tools or IaC scripts pushing these new features, releases, or updates.
Identify Root Cause and Prevent Cost Overrun
Correlating the source of observability behavior anomalies requires the ability to detect those changes at a granular level sufficient to narrow down the application, team, namespace, or repo and correlate it with the relevant activity to quickly narrow down which team, which application, which repo, and if possible which developer is responsible. Temporary filtering and control mechanisms can prevent a cost overrun catastrophe, and the attribution and correlation will enable you to identify the root cause to turn off the problem at the source and determine its business or technical validity.
3. Cost-Effectively Generate, Share New Business Custom Metric KPIs
Why can’t observability tools give you the information you really need? While you can easily get thousands if not millions of infrastructure or application measurements, the KPIs for your business that technology leaders and other teams are seeking such as overall health, capacity metrics and trends, or COGs remain elusive. Many functions – such as Product Management or Customer Experience teams – get frustrated when they can’t get what they need from observability tooling so they resort to buying their own tools and software experience platforms to get access to data that is available but siloed and hidden from other organizations.
Escape the Observability Tool Silo – Get Data to the Right Stakeholders
ControlTheory Elastic Telemetry Pipelines can route, split, and enrich data to ensure they get to the teams that need it, versus stuck in an observability tool silo. Efficient use of custom metrics to avoid expensive cardinality penalties, opens up and incentivizes the introduction of new business KPIs, versus penalizing organizations when they seek to customize measurements unique and critical to their business.
4. Mask Observability for Safe, Compliant, and Secure Data Sharing
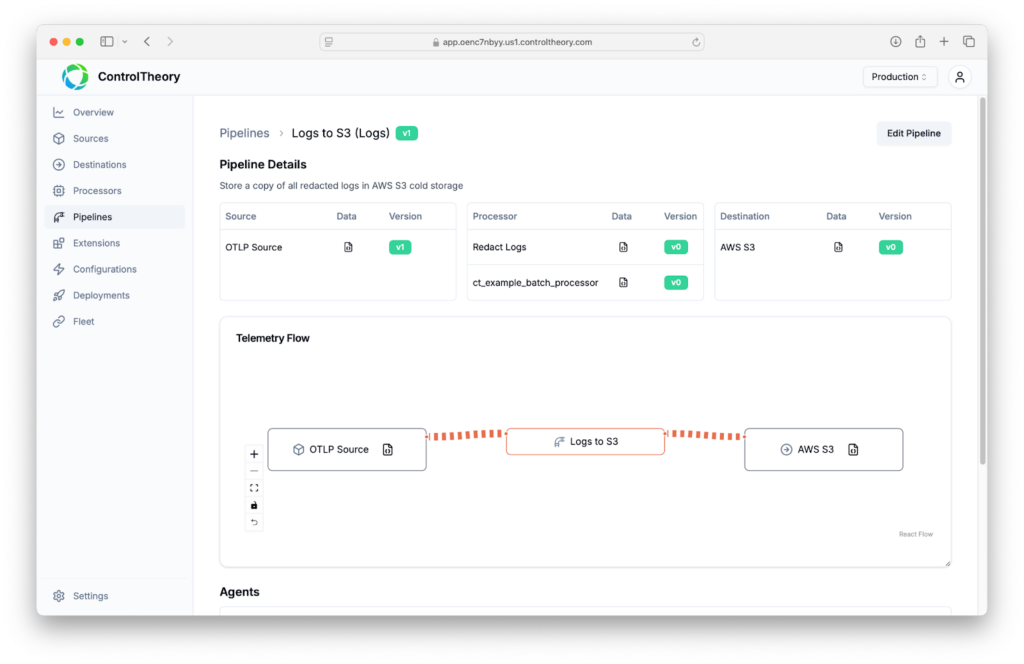
Observability telemetry can contain sensitive and private data that must be masked, redacted, or obfuscated for compliance and regulatory policies and laws. This requires proper telemetry governance to detect then redact or mask sensitive PII (personally identifiable information) such as account numbers, credit card details, or sensitive health information such as PHI (protected health information) for HIPAA compliance. ControlTheory masks telemetry data in flight so you can confidently and legally share it with offshore teams, internal organizations, and broader platform and incident management groups.

5. Store Traces for Latency Regression Analysis
While traces are critical signals for monitoring application performance and detecting and troubleshooting latency issues, traces often generate a significant volume of data that can overwhelm your existing observability platform and result in unexpected observability bill surprises. This often inhibits many teams from implementing or effectively using traces, which can be the most powerful tool in root cause and application performance analysis.
Route Useful Telemetry Data while Using Low-Cost Storage
ControlTheory Elastic Telemetry Pipelines can intelligently tail-sample (link above) traces to send only the most important and relevant traces to your observability endpoint while routing all the traces to lower-cost storage for later regression analysis. By analyzing histories of aggregated traces you can spot performance degradations that are not obvious with short-term monitoring. This opens up new capabilities to answer questions like, “is our customer experience actually improving across software releases?”
Summary – How to Create New Observability Data Insights?
Controllability optimizes current observability solutions to improve root cause analysis, shorten MTTR, open up new KPIs, and ensure compliance and security of your telemetry data.
ControlTheory observability optimizations sharpen RCA with powerful trace tail-sampling, offline regression analysis, and correlation of developer-driven changes to observability behavior anomalies. Observability can blossom with new, cost-effective, shareable business KPIs and secure, compliant telemetry governance in flight.
